
Thousands of dollars.
That’s how much a company can lose every month if its landing page conversion rate falls below what’s actually possible.
Every visitor who bounces represents real revenue walking away.
But here’s what’s interesting: a competitor in the same niche, selling a similar product at a higher price, can convert at a rate that’s double or triple the other’s.
This happens constantly. And the gap rarely comes down to budget or design talent. It comes down to knowing what “good” actually looks like in your specific situation.
The truth about landing page conversion rates in 2026 will probably shift your thinking.
Depending on the dataset, reported benchmarks range widely, and that’s not a contradiction.
It reflects how dramatically conversion rates vary based on industry, traffic source, offer type, and what “conversion” actually means on a given page.
In some industries, top performers are hitting 30-40% conversion rates. In others, breaking 2% is considered strong.
The difference often comes down to knowing three key things:
- Your actual numbers (most marketers track this wrong)
- What’s truly possible in your specific niche
- Which landing page optimization tactics actually move the needle
Let’s discover what’s possible with your landing pages.
Article Breakdown
- What Is Landing Page Conversion Rate?
- Why Tracking Landing Page Conversion Rates Matters
- What’s the Average Landing Page Conversion Rate in 2026?
- Benchmarks for Landing Page Conversion Rate
- How Can You Improve Your Landing Page Conversion Rate?
- Beyond the Numbers: Your Next Move
What Is Landing Page Conversion Rate?
A landing page conversion rate is the percentage of site visitors who complete a desired action on your landing page.
It’s a useful metric that tells you how effectively your landing page converts.
If you want to understand the key components that influence conversion rates, you need to know the anatomy of a landing page and understand how each element influences visitor behavior.
Breaking Down the Concept
At its core, a landing page conversion rate measures the relationship between two key numbers:
- The total number of people who visit your landing page
- The number of those visitors who complete your desired action
The “desired action” or conversion can vary significantly depending on your goals. It might be:
- Making a purchase
- Signing up for a newsletter
- Downloading an ebook or whitepaper
- Registering for a webinar
- Starting a free trial
- Filling out a contact form
- Scheduling a demo
How to Calculate Landing Page Conversion Rate
The formula for calculating your landing page conversion rate is straightforward:
Conversion Rate CR = (Number of Conversions ÷ Total Number of Visitors) × 100
Basic Calculation Method
Before you compute your landing page conversion rate, define the time period first. It could be daily, weekly, monthly, or quarterly. Whatever you choose, stay consistent.
Choose a period that matches your business cycles. For example, if conversion for you is a lead and you contact new leads every week, set your measurement period to weekly.
Once you’ve set your timeframe, you’ll need two pieces of data:
- The total number of visitors to your landing page, gathered from your analytics, and
- The number of successful conversions during that period.
For instance, if last week 50 people converted out of 1,000 visitors, you calculate the landing page conversion rate like this:
CR = (50 ÷ 1,000) × 100 = 5%
Advanced Calculation Considerations
As you get better at tracking, you’ll want to segment your data for deeper insights.
Segment based on Traffic Source
Traffic sources play a crucial role in conversion performance. Your landing page might convert differently for visitors coming from organic search, paid campaigns, social media, or email.
Segment based on Conversion Type
Modern landing pages often have multiple types of conversions happening simultaneously. Separate your conversion rate calculations based on conversion type for a clearer picture.
Segment based on User Quality
Not all visitors are equally likely to convert. When analyzing your landing page conversion rate, consider:
- The quality of your traffic sources
- How long visitors stay on your page
- Whether they engage with your content
- If they match your target audience profile
Why Tracking Landing Page Conversion Rates Matters
- Business Impact Assessment
Landing page conversion rate directly ties marketing efforts to business results. It helps quantify ROI for campaigns and identifies which offers resonate with your audience.
- Resource Optimization
It shows whether your traffic acquisition efforts are paying off, so you can allocate budget more effectively and identify which landing pages need attention or further testing.
- Performance Benchmarking
Conversion rate data helps set realistic goals and provides a clear metric for measuring improvements over time. Did the changes you applied deliver better results? It also gives you a consistent point of comparison across different campaigns.
- Customer Understanding
Conversion rate reveals how well you’re meeting visitor expectations. Are you targeting the right audience? Is your value proposition compelling enough?
- Real Impact on Your Bottom Line
If your landing page gets 10,000 monthly visitors, a 2% conversion rate gives you 200 conversions. A 3% rate gives you 300.
That 1% difference means 100 additional conversions per month at the same traffic cost. Small changes in conversion rate compound fast.
What’s the Average Landing Page Conversion Rate in 2026?
There is no single “perfect” number, and in 2026, the range of reported benchmarks is wider than ever.
That’s not because the data is unreliable. It’s because different studies measure different things.
Some track email sign-ups, others track qualified leads, and others track direct purchases. The conversion goal changes everything.
Here’s how the major benchmark datasets compare:
- WordStream (broad cross-industry dataset): median of 2.35%, top 25% at 5.31% or higher, top 10% at 11.45% or higher
- GetResponse (18 industries, opt-in focused pages): average of 10.76% higher due to email-driven traffic and low-commitment conversions
- First Page Sage (80+ B2B clients, MQL-focused): 3.6% B2B, 3.9% B2C
None of these numbers is wrong. They reflect different audiences, traffic sources, and levels of conversion intent.
The key takeaway is simple:
- Low-friction actions (email opt-ins, webinars) convert at much higher rates
- High-intent, high-value actions (demos, consultations, purchases) convert lower
- Top performers consistently achieve 2-3x the average in their category
If you want a useful benchmark, don’t ask “what’s the average?”
Ask instead: what’s the average for my traffic, my industry, and my conversion goal?
This is why industry-specific benchmarks matter far more than generic averages.
Benchmarks for Landing Page Conversion Rate
Conversion Rate Benchmark Based on Industry
Industry is one of the most reliable predictors of landing page conversion rate because it determines deal complexity, buyer intent, sales cycle length, and the level of commitment required for conversion.
The most comprehensive recent industry-specific dataset comes from First Page Sage’s 2026 report, based on data from 80+ clients across industries between 2021 and 2025.
Conversions in this study are defined as contact form fills, demo sign-ups, appointment bookings, and other MQL-generating actions, not micro-conversions such as newsletter sign-ups.
Here’s the breakdown:

- Legal Services: 7.4% – high intent, short decision cycles, and a compulsory-feeling need all drive strong conversion
- Healthcare: 3.0-4.2% – trust barriers and compliance requirements keep rates moderate; top performers reach 8–10%
- eCommerce: 4.3% – transactional audiences convert well; limited-time offers and discount pages push rates higher
- Financial Services / Insurance: 1.7-2.3% – complexity of information and long decision processes weigh on conversion; paid social is a bright spot
- Professional Services / Consulting: 1.7-6% – wide range depending on whether the firm competes on specialization (higher) or is perceived as a commodity (lower)
- Construction: 1.9% – high project costs and slim margins slow decision-making; free consultations help
- B2B SaaS: 1.1% – long sales cycles and multi-stakeholder decisions drive the lowest rates; free trials and freemium models improve conversion significantly
- Cybersecurity: 1.3% – growing demand but high competition; trust-building content is essential
- Biotech / Aerospace: 1.8% – large deal sizes and regulatory complexity create friction throughout the funnel
GetResponse’s benchmark data, based on landing pages across 18 industries and largely focused on email-driven opt-in pages, shows a different but complementary picture at the high end.
Lower-commitment conversions consistently drive much higher conversion rates:
- Restaurants & Food: 39.93%
- Legal Services: 25.05%
- Communications: high double digits
- Retail: 0.70% – the lowest in the dataset, reflecting purchase friction and high comparison shopping behavior
The spread between those two datasets (1.1% for B2B SaaS leads vs. 39.93% for restaurant sign-ups) is not a contradiction.
It reflects the single most important variable in conversion rate benchmarking: what are you asking the visitor to do, and how much does it cost them?
Use these benchmarks as a directional reference.
A 3% rate on a high-ticket B2B demo request is a strong result. A 3% rate on a low-friction email opt-in page is underperforming by a wide margin.
Landing Page Conversion Rate Benchmark Based on Traffic Source
Traffic source is one of the biggest variables in landing page performance.
Ruler Analytics’ study of over 100 million data points across 14 industries gives us the most granular non-platform breakdown available. Here’s how the major channels perform:
Social Media (1.5% average)
Social media shows the lowest conversion rates across channels, reflecting the browsing intent of most social users. Performance varies by industry:
- Healthcare leads at 3.0%
- Travel and tourism reaches 2.7%
- B2B services at 2.4%
- B2C services (0.1%) and B2B ecommerce (0.4%) at the low end
Facebook Ads have historically shown strong conversion rates across many industries when traffic is sent to a dedicated landing page, though performance varies widely based on targeting, offer, and funnel structure.
Industries such as fitness, education, employment, healthcare, real estate, and B2B see the strongest results from this channel.
Organic Search Traffic (2.7% average)
Organic search delivers visitors with genuine intent, which shows in its solid conversion performance across most industries (Ruler Analytics):
- Professional services and industrial sectors lead with 5.0% and 4.4%
- Healthcare and legal at 2.4% and 3.0%
- Agencies and B2B ecommerce at the low end (1.5%)
Paid Search (3.2% average)
Paid search converts well when ad messaging and landing page copy are tightly matched. Ruler Analytics data shows (across industries):
- Professional services and finance leading at 5.0-5.2%
- Healthcare at 1.9%, automotive at 3.9%
- B2B tech and ecommerce at the low end (1.5-1.7%)
Email Marketing (2.6% average)
Email consistently outperforms social as a conversion channel and is especially effective for warm, pre-existing audiences (Ruler Analytics):
- Automotive and real estate lead at 3.9% and 3.5%
- Industrial at 2.9%, healthcare at 2.6%
- B2C services and agencies at the low end (0.9–1.9%)
Note: GetResponse’s data, which measures opt-in landing pages driven primarily by email, shows far higher conversion rates for email traffic.
The 2.6% Ruler Analytics figure reflects a broader mix of email types, including cold and semi-warm outreach.
For a warm, segmented email list driving traffic to a dedicated landing page, you should expect significantly higher performance than 2.6%.
Direct Traffic (3.3% average)
Direct traffic converts at the highest rate across channels, reflecting the intent of visitors who seek you out specifically (Ruler Analytics):
- Healthcare and dental at 5.3%
- Industrial at 5.0%
- Professional services at 2.7%
- B2B tech at 1.5%
Direct makes up around 20% of overall traffic for most businesses.
These visitors are typically already familiar with your brand and are at a more advanced stage in the buying process, which is why their conversion rate is consistently the highest across all channels.
Referral Traffic (2.9% average)
Referral visitors arrive with pre-built trust from a credible third party, which drives above-average conversion (Ruler Analytics):
- Dental and cosmetic at 4.1%
- B2B ecommerce and financial services at 3.9%
- Travel at the low end (1.0%)
Conversion Rate Benchmark Based on the Type of Landing Page
Your page type benchmark often matters more than your industry benchmark. A 5% conversion rate can be excellent or terrible, depending entirely on what kind of page you’re running. Here’s what current data shows for each major type:
Lead Generation Pages (9-12% Average)
Lead-gen pages outperform direct-sales pages because the commitment is lower: contact info, not payment details. The best performers in this space reach 20-30% through:
- Dynamic forms that adapt to user behavior
- Social proof matched to visitor demographics
- Targeted lead magnets for specific audience segments
Even average performers can hit 9-12% by keeping form fields minimal and tightly aligning the page content with audience intent.
Webinar Registration Pages (around 22% average, top performers 50-60%)
Webinar pages are consistently among the highest-converting page types. GetResponse’s analysis of landing pages promoting webinars found an average conversion rate of 22.84%, compared to its overall average of 10.76%.
The best ones reach 50-60% by hitting four conversion triggers simultaneously:
- Urgency: a specific date creates a deadline
- Low commitment: just one hour of time
- Clear value: a specific skill or insight in exchange
- Social proof: a credible speaker or brand
Product Pages (2-5% Average)
Product pages have the hardest job: converting cold traffic directly into purchases. Their lower rate is not a sign of failure. A 3% conversion rate on a $1,000 product beats a 15% rate on a $10 ebook any day.
Top product pages pushing into the 10-15% range win by removing purchase friction at every step:
- 360° product views
- Real customer photos and reviews front and center
- Live inventory signals create natural urgency
- Smart pricing displays that encourage action
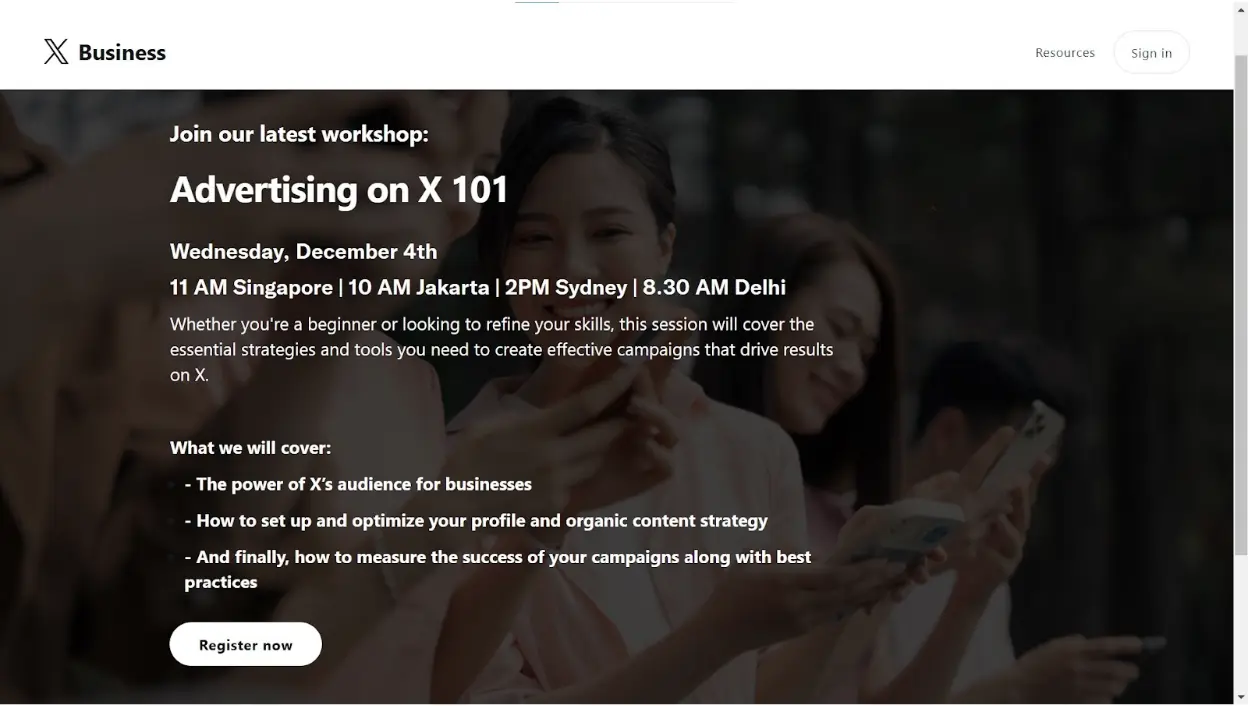
Newsletter Subscription Pages (10-20% Average)
Newsletter pages that perform well in 2026 win on exclusivity and transparency. Top performers reach 30-40% by:
- Offering content unavailable elsewhere
- Showing rave reviews from current subscribers
- Letting visitors preview past issues before signing up
- Making the unsubscribe promise visible upfront
Pages that underperform are almost always the ones that lead with vague “stay in the loop” propositions and offer no preview of what’s inside.
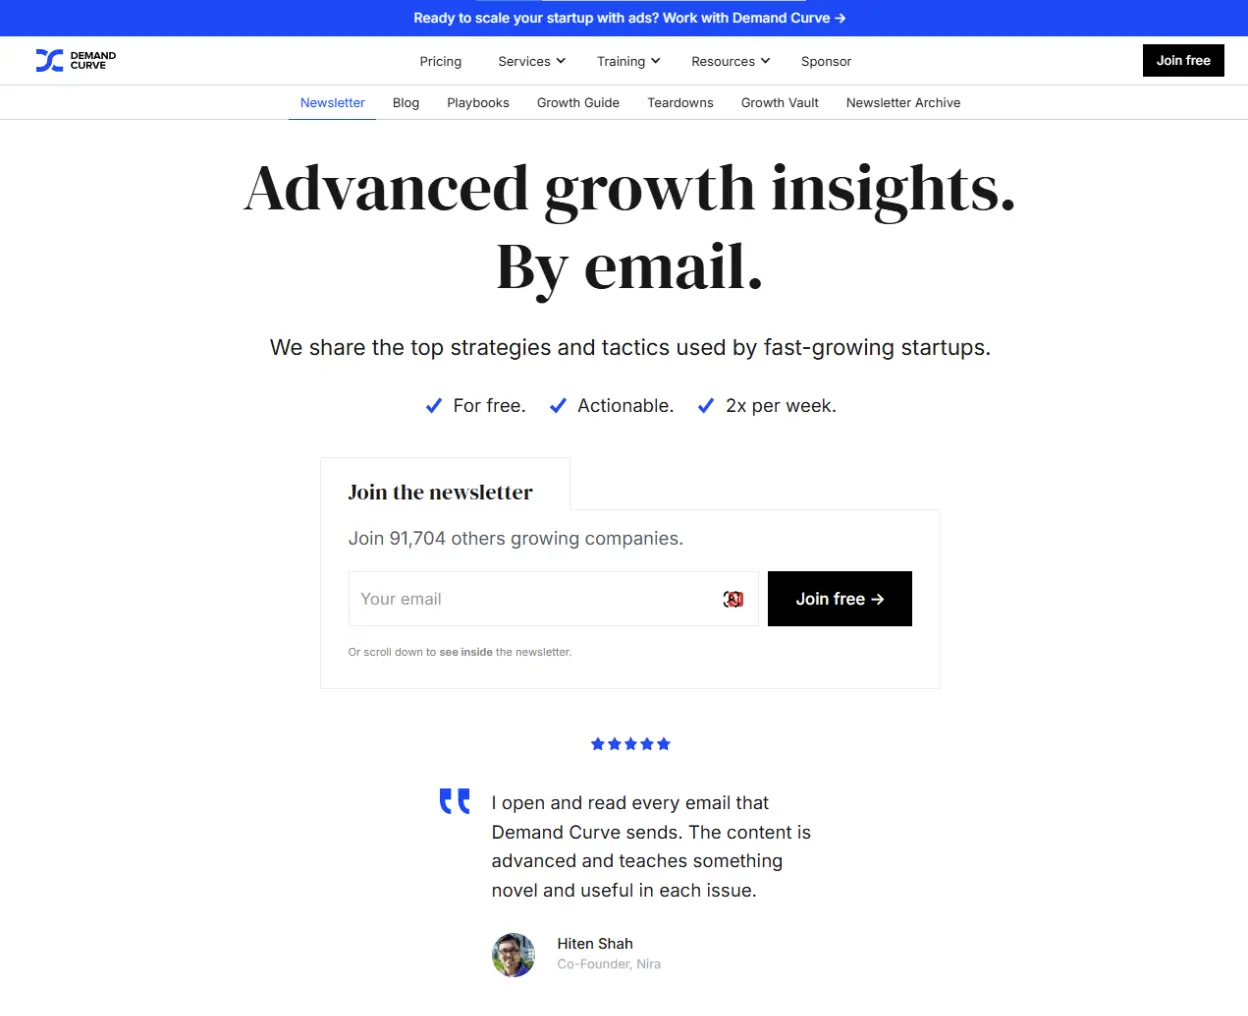
Example of a high-performing newsletter landing page. A clear value proposition, strong social proof, and low-friction sign-up contribute to higher conversion rates.
Free Trial Sign-Up Pages (5-15% Average)
Free trial pages sit between lead gen and direct sales in terms of commitment.
Top performers reach 25-30% by making one thing unmistakably clear: there’s nothing to lose. The highest-converting pages lead with:
- “No credit card required” messaging front and center
- A streamlined onboarding path to first value
- Reviews from free users who became paying customers
Other Aspects that Have an Impact on Landing Page Conversion Rate
Geography
Regional differences play a crucial role in conversion rates. Markets with higher digital maturity often see different patterns than emerging markets. Cultural differences, local competition, and market saturation all influence what constitutes a “good” conversion rate in different regions.
Device and Platform
Desktop users consistently convert at higher rates than mobile users across most industries. First Page Sage’s 2026 benchmarks put B2C averages at 3.9% and B2B at 3.6% overall, with desktop outperforming mobile across most sectors.
Mobile accounts for the majority of traffic, making mobile optimization essential regardless, but the higher-intent conversion moment still tends to happen on desktop for most industries.
One notable exception: legal and financial services in some datasets show stronger mobile conversion rates, likely due to the high-urgency nature of those queries (someone who needs a lawyer or an insurance quote often searches on mobile and converts quickly).
Landing Page Speed
Page speed has a direct and measurable impact on conversion rate. According to Portent, here’s how load time affects conversion:
- Under 1 second: 31.79%
- 1 second: 20.28%
- 2 seconds: 13.93%
- 5 seconds: 9.68%
Every extra second costs you a measurable share of conversions. This is one of the few CRO levers where the impact is unambiguous and consistent across industries.
Why “Average” Shouldn’t Be Your Goal
A landing page converting at 3% might be performing exceptionally well if it’s operating in a highly competitive B2B market, targeting a premium audience, or driving high-value, qualified leads rather than general traffic.
Conversely, a page converting at 8% might be underperforming if it’s working with warm, pre-qualified direct traffic, offering a low-commitment opt-in, or running in a category where the benchmark is 20%+.
The top performers in every sector prove that conversion rates two or three times the average aren’t just possible: they’re achievable with the right strategy.
Use the benchmark that most closely matches your reality: your traffic source, your conversion type, and your industry. That context is far more valuable than chasing a generic number.
How Can You Improve Your Landing Page Conversion Rate?
Want to boost your landing page conversion rates? First, make sure you avoid making landing page mistakes that could be holding your conversions back. Here’s what actually works in 2026:
1. Nail Your Message-to-Market Match
If visitors click an ad about blue widgets, your landing page better talk about blue widgets. This isn’t just about matching words. It’s about maintaining the conversation your visitor thought they’d started.
The best-performing pages are consistent from ad to landing page: headlines, images, offers, and tone of voice all match. Using the right landing page images ensures visual consistency, reinforcing your message and keeping visitors engaged.
2. Make Mobile Your Priority
Mobile drives the majority of landing page traffic across industries. If your mobile experience is an afterthought, you’re handing conversions to competitors. The most successful mobile-optimized pages focus on:
- Forms that work perfectly with thumbs
- Load times under 2 seconds
- Click targets sized and spaced for fingers
- Zero horizontal scrolling
3. Build Trust Fast
Nobody converts on blind faith. Smart landing pages build trust through layered social proof that feels authentic and relevant.
According to HubSpot, including social proof below a landing page CTA can increase its conversion rate by 68%. Your trust-building toolkit should include:
- Customer testimonials that match your visitor’s profile
- Live conversion notifications that feel genuine
- Trust badges that carry real weight in your industry
4. Simplify Your Forms
Every form field you add chips away at your conversion rate. The most successful landing pages ask for only the absolutely essential information.
GetResponse’s data shows that forms with one to three fields outperform longer forms, and there’s actually more room to ask for information than most marketers assume.
Up to three fields still convert well. Break longer forms into digestible multi-step flows and use auto-fill wherever possible.
5. Master Your Value Proposition
You’ve got seconds to capture attention. A winning value proposition needs to immediately answer:
- What’s in it for them?
- Why should they care?
- How are you different?
- Why act now?
The best pages don’t bury these answers in dense paragraphs. They make them impossible to miss.
6. Speed Up Everything
Slow pages are a conversion killer. Implement lazy loading for below-the-fold content and leverage browser caching effectively.
As Portent’s data shows, the difference between a 1-second and a 5-second load time is more than a 20-point drop in conversion rate. Every millisecond counts.
7. Test Smart, Not Hard
Focus your testing on elements that actually move the needle: headlines targeting different pain points, lead magnet formats, social proof approaches, and form layouts.
Only 1 in 8 A/B tests produces a statistically significant result, so prioritize tests that could genuinely change how visitors perceive and interact with your offer, not cosmetic tweaks.
8. Use Scarcity (Without Being Sleazy)
Real scarcity drives action. Fake scarcity destroys trust. The winning approach uses actual inventory counts, genuine time limits, and real capacity constraints.
Your visitors can tell the difference. Communicate real limitations honestly, and you build both trust and urgency.
9. Optimize for Quality, Not Just Quantity
A high conversion rate means nothing if you’re attracting the wrong leads. Be upfront about who your product or service isn’t for. Show pricing when relevant.
Use self-selection tools that help visitors determine if they’re a good fit. High-quality conversions are worth more than a high conversion rate.
10. Make Your CTA Irresistible
Make it crystal clear what happens when someone clicks. Be specific about what they’re getting and remove any hint of risk.
According to HubSpot, personalized CTAs perform 202% better than generic ones. Ensure your CTA is visible without scrolling and uses action-oriented language that compels clicks.
11. Track Beyond Basic Metrics
The most successful optimizers look beyond simple conversion rates. Track:
- Bounce rates by traffic source
- Time to first interaction
- Form abandon patterns
- Exit page hotspots
Pay special attention to how return visitors convert compared to first-time visitors. This often reveals your biggest opportunities for improvement.
12. Personalize Thoughtfully
Effective personalization goes beyond swapping out names. Consider your visitor’s traffic source, previous interactions with your brand, industry, company size, location, and time of day.
Use this information to tailor your message and offer. Good personalization feels natural and helpful, not creepy or invasive.
Beyond the Numbers: Your Next Move
Conversion rates are not a scoreboard. They are a diagnostic tool.
The biggest mistake marketers make in 2026 is picking a single benchmark number and chasing it without context.
A 3% rate can be excellent or terrible. A 25% rate can be impressive or expected, depending on what you’re measuring, who your traffic is, and what you’re asking them to do.
The three most useful benchmarks to anchor to are these: WordStream’s cross-industry median of 2.35% provides a broad floor for mixed-traffic pages.
First Page Sage’s industry-specific MQL data (1.1% for B2B SaaS to 7.4% for legal services) gives you the right target if your goal is qualified lead generation.
GetResponse’s opt-in page data (10.76% average, 22.84% for webinar pages) shows what’s possible when traffic intent is high and commitment is low.
The pages consistently hitting top-quartile performance are not doing it with bigger budgets or fancier design.
They remove friction, match the message to the audience, build trust quickly, and test the variables that actually change behavior. Then they do it again.
Small improvements compound fast. Moving from 2% to 3% on a page with 10,000 monthly visitors means 100 additional conversions without spending a dollar more on traffic. That math holds at every scale.
The best-converting landing pages are not launched once and left alone. They are tested, adjusted, and improved over time. The next change you make could be the one that moves the needle.
![15 Best Ad Spy Tools for Affiliate Marketers [2026 Comparison]](https://wp.landerlab.io/wp-content/uploads/2024/10/Top-9-Ad-Spy-Tools-in-2025_-1.webp "15 Best Ad Spy Tools for Affiliate Marketers [2026 Comparison]")

![100+ Powerful Call to Action Phrases That Actually Convert [2026]](https://wp.landerlab.io/wp-content/uploads/2025/04/50-Powerful-Call-to-Action-Phrases-that-Convert.webp "100+ Powerful Call to Action Phrases That Actually Convert [2026]")
